The evolution of the post-consumer plastic packaging waste flows in Flanders
Abstract
G. Thomassen, J. Dewulf, S. Van Passel, L. Alaerts
The plastic packaging recycling rate monitors how much of this waste flow is recycled for a specific year and region. To reach the new target of 65% in 2023, multiple improvements in the waste management system in Flanders are planned or already adopted. However, the recycling rate that needs to be reported only looks at the total mass of recycled post-consumer plastic packaging waste, without differentiating for the quality of the recycled material and the individual material. In addition, the recycling rate calculation rules change over time and still leave some room for interpretation.
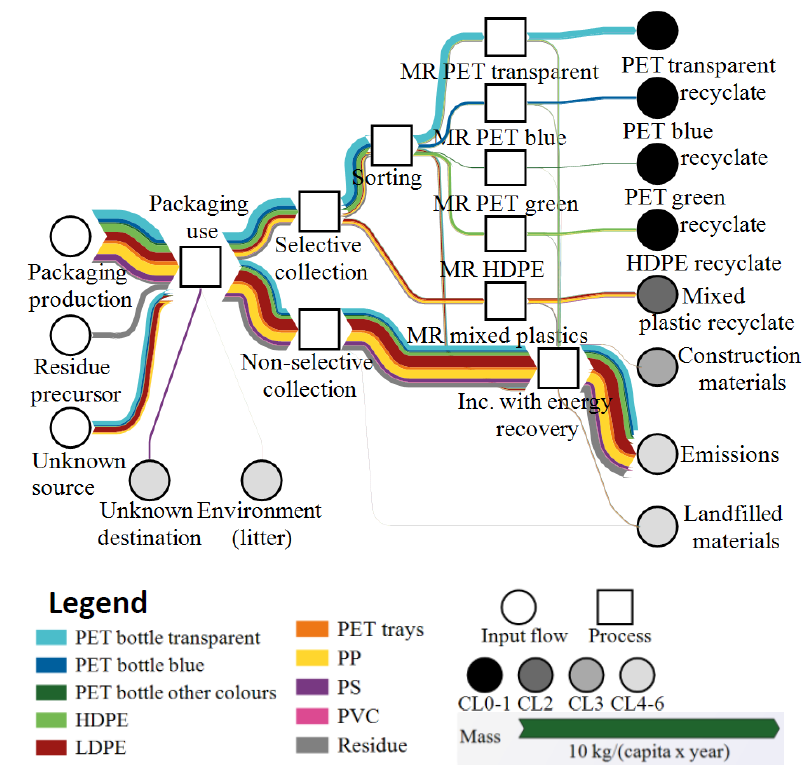
To quantify the past and expected evolution of the recycling rate the material flows of the post-consumer plastic packaging waste flow in Flanders have been tracked in a material flow analysis. The Sankey diagram resulting from the material flow analysis for 2019 is provided in Figure 1. The quality of the recycled material was classified by means of cascading levels. The highest cascading level indicated recycling to the highest-value secondary product, secondary plastic packaging in this case. Lower cascading levels were used for lower-value secondary products, such as road construction materials, indicating downcycling. In current policies, this differentiation is usually not made and all recycling is treated ‘equally’.
In the period 1985-2019, the recycling rates ranged from 0% in 1985 to 31% in 2019. Taking into account multiple improvement scenarios, a maximum recycling rate of 61% could be achieved. The flexibility in the calculation rules was for example due to the exclusion of recycling losses in the calculation of the recycling rate. This flexibility induced a variation of up to 41% on the recycling rate, which is detrimental for obtaining comparable recycling rates over time and space. The sensitivity analysis highlighted the importance of the amount of plastic packaging in the residual waste collection for the overall recycling rate.

Figure 1. Sankey diagram of 2019 (MR: mechanical recycling, Inc. incineration, CL: cascading level; PET: polyethylene terephthalate); HDPE: high-density polyethylene; LDPE: low-density polyethylene; PP: polypropylene; PS: polystyrene; PVC: polyvinyl chloride
The material flow analysis enables to track all material flows in the system and provides a clear insight in data gaps and their impact on the recycling rates. The use of material flow analyses also assists in harmonizing the calculation of the recycling rates and the differentiation for different cascading levels and materials.
The policy recommendations from this paper are fivefold:
- To continuously apply material flow analysis for the post-consumer plastic packaging waste system
- To obtain a better insight in the amount of plastic packaging in the residual waste
- To couple the reporting of the recycling rate to MFAs with stricter calculation rules
- To differentiate in the recycling rate for the quality of secondary materials i.e., cascading levels
- To differentiate in the recycling rate for the individual materials

.png)


